— by Aidan Doak
Hydrologists and environmental scientists often look at river flow through time and focus their attention to the minimum, maximum and average values. These values are used to answer questions regarding dry and wet periods, which can lead to hydrological droughts or floods. Less often do we look at the variation of flow over time, which is an indication of how dynamic or “flashy” a given river location is, and how strongly it may be coupled to rainfall inputs. Flow variability is not only important for characterizing hydrological regimes but also for ecological reasons, as some aquatic species require a variety of flow conditions through their different life stages. With that in mind, I did a quick explanatory analysis of flow records from 22 hydrometric stations across the Grand River Watershed.
Ten years (2008-2018) of daily river flow values were analyzed. The coefficient of variation (CV) of flow, which is simply the standard deviation divided by the arithmetic mean, was computed for individual stations over (1) the whole period of record, (2) for individual years, and (3) for individual months grouped across all years. The goal was simply to visualize whether spatial patterns of flow variability change depending on the year or month considered.
Figure 1 shows, for each hydrometric station, CV values (shown as blue circles) calculated using the ten years of daily river flow data. It clearly shows the larger flow variability of headwater locations, compared to downstream locations.

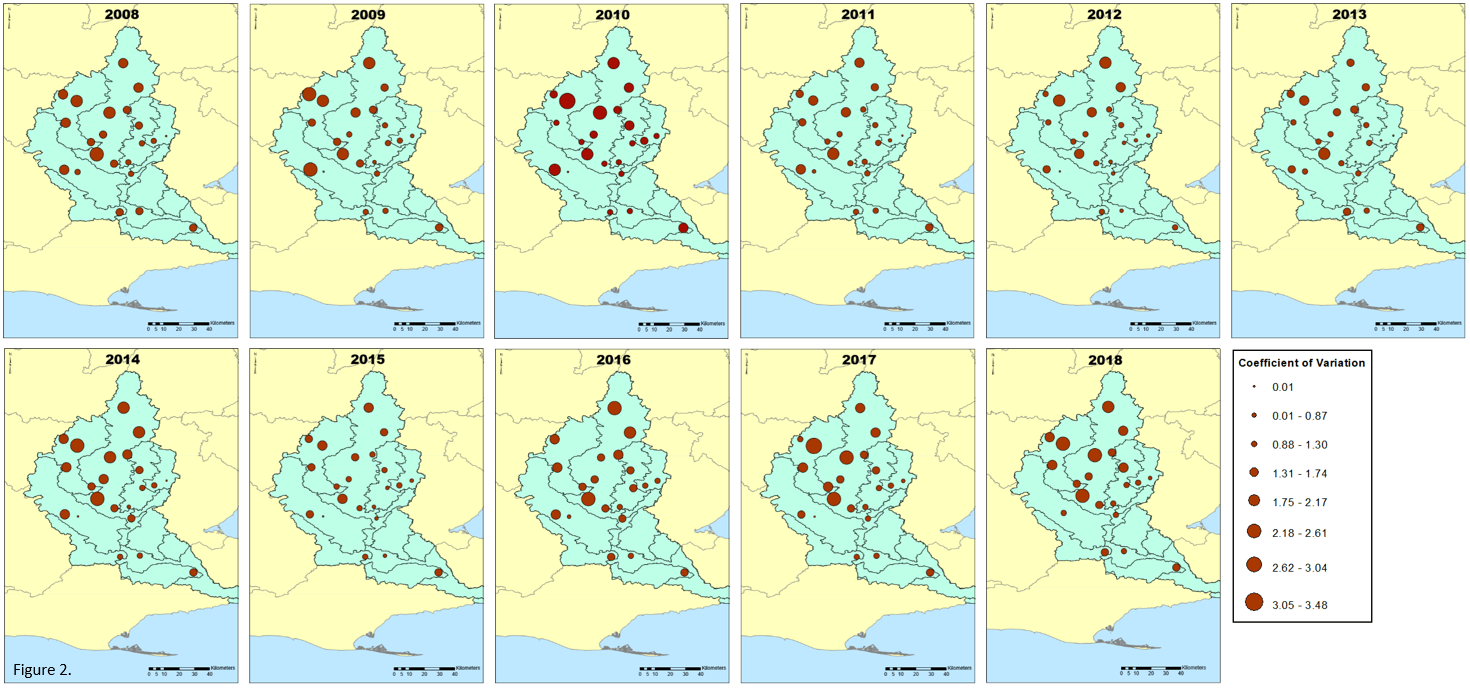
To accompany the set of yearly maps (Figure 2), I calculated the total annual rainfall using the Laurel Creek rain gauge station located in the center of the watershed (Figure 3). A quick, visual assessment of Figures 2 and 3 shows that on a yearly basis, CV values do not increase or decrease monotonically as we move from the headwaters downstream. Also, CV values are not necessarily higher or lower in years with less rainfall.

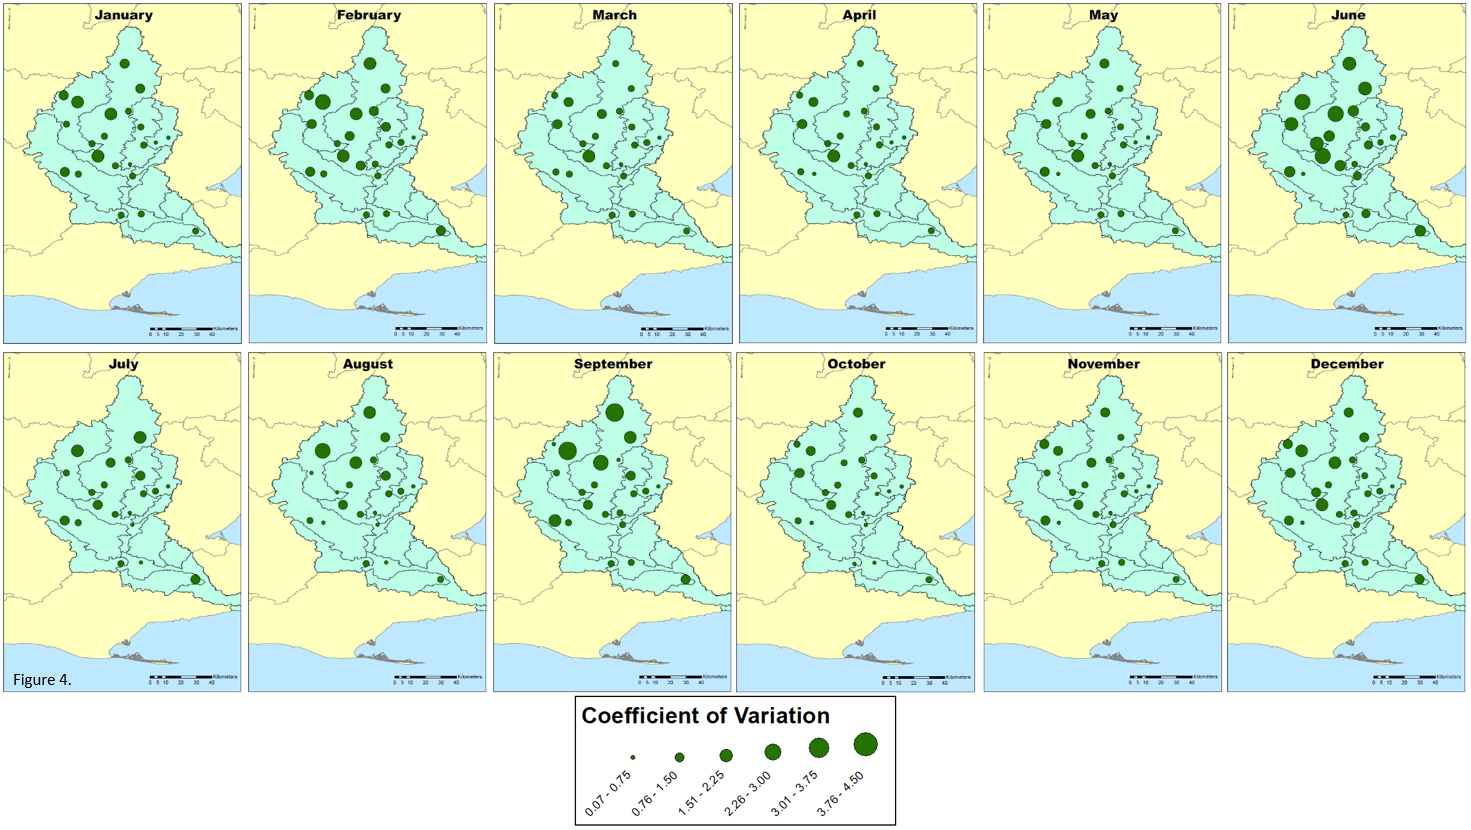
Seasonality of flow variation is evident when the data is displayed monthly (Figure 4), but this time again the location with the highest variability are located in the headwaters. While those results are not surprising, they do highlight the critical importance of headwaters for the hydrological and ecological integrity of watersheds.
